Payroll ANALYTICS for Teamshares
Payroll ANALYTICS for Teamshares
Payroll ANALYTICS for Teamshares
Scaling Employee-Owned Businesses Through Systems-Level Design
Scaling Employee-Owned Businesses Through Systems-Level Design
Scaling Employee-Owned Businesses Through Systems-Level Design
Teamshares acquires small businesses from retiring owners and converts them into employee-owned companies. As the design lead, I was tasked with addressing a critical bottleneck: the organization’s Industry Leads spent valuable time manually compiling payroll insights, inhibiting their ability to scale across 90+ Network Companies.
Teamshares acquires small businesses from retiring owners and converts them into employee-owned companies. As the design lead, I was tasked with addressing a critical bottleneck: the organization’s Industry Leads spent valuable time manually compiling payroll insights, inhibiting their ability to scale across 90+ Network Companies.
50%
increase in
productivity
135 hrs
saved
per cycle
$3.1M
annual
efficiency gains

Background
Background
Background
Teamshares is a startup based out of Brooklyn, New York. They acquire small to medium sized businesses from their retiring owners and convert these acquisitions into employee-owned companies. Teamshares subsequently installs leadership who would then be advised by Teamshares' Industry Leads.
To support these Network Companies, Teamshares has a suite of products built specifically for their use cases.
Strategic insight
Strategic insight
Strategic insight
Reframing the problem
Reframing the problem
Reframing the problem
Initial requests centered on “making reports easier to generate.” Through discovery, I found the root issue was:
Initial requests centered on “making reports easier to generate.” Through discovery, I found the root issue was:
Data lived in disparate, inconsistent systems
Data lived in disparate, inconsistent systems
Data lived in disparate, inconsistent systems
Data lived in disparate, inconsistent systems
Industry Leads lacked centralized visibility into real-time payroll health
Industry Leads lacked centralized visibility into real-time payroll health
Industry Leads lacked centralized visibility into real-time payroll health
Industry Leads lacked centralized visibility into real-time payroll health
Analyses were delayed by 3–5 days due to manual processes
Analyses were delayed by 3–5 days due to manual processes
Analyses were delayed by 3–5 days due to manual processes
Analyses were delayed by 3–5 days due to manual processes
I shifted the conversation:
I shifted the conversation:
From: “How do we automate reports?”
To: “Deliver the right data at the right time to enable scalable, intelligent decision-making.”
From: “How do we automate reports?”
To: “Deliver the right data at the right time to enable scalable, intelligent decision-making.”
From: “How do we automate reports?”
To: “Deliver the right data at the right time to enable scalable, intelligent decision-making.”
My mission was to eliminate operational friction so Industry Leads could focus on what matters most - helping our Network Companies succeed.
My mission was to eliminate operational friction so Industry Leads could focus on what matters most - helping our Network Companies succeed.
I shifted the conversation:
From: “How do we automate reports?”
To: “How do we give Industry Leads the right data, at the right time, to scale intelligently?”
From: “How do we automate reports?”
To: “How do we give Industry Leads the right data, at the right time, to scale intelligently?”
My mission was to eliminate operational friction so Industry Leads could focus on what matters most - helping our Network Companies succeed.
Personnel
Design lead (myself)
Design lead (myself)
Design lead (myself)
Design lead (myself)
1 Product Manager
1 Product Manager
1 Product Manager
1 Product Manager
Finance & Industry Lead stakeholders
Finance & Industry Lead stakeholders
Finance & Industry Lead stakeholders
Finance & Industry Lead stakeholders
My role
As the sole product designer on this effort, I:
As the sole product designer on this effort, I:
Reframed the problem from “reporting” to “operational leverage”
Reframed the problem from “reporting” to “operational leverage”
Reframed the problem from “reporting” to “operational leverage”
Reframed the problem from “reporting” to “operational leverage”
Drove alignment across finance, data, and engineering
Drove alignment across finance, data, and engineering
Drove alignment across finance, data, and engineering
Drove alignment across finance, data, and engineering
Led end-to-end design, from discovery to delivery
Led end-to-end design, from discovery to delivery
Led end-to-end design, from discovery to delivery
Led end-to-end design, from discovery to delivery
Pitched the dashboard vision to the executive team
Pitched the dashboard vision to the executive team
Pitched the dashboard vision to the executive team
Pitched the dashboard vision to the executive team

Driving alignment
Driving alignment
Driving alignment
This project spanned:
This project spanned:
Finance leadership (to define the most critical metrics)
Finance leadership (to define the most critical metrics)
Finance leadership (to define the most critical metrics)
Finance leadership (to define the most critical metrics)
Data engineering (to align on data model viability)
Data engineering (to align on data model viability)
Data engineering (to align on data model viability)
Data engineering (to align on data model viability)
Ops team (to validate real-world usability)
Ops team (to validate real-world usability)
Ops team (to validate real-world usability)
Ops team (to validate real-world usability)
Cross-functional leadership
Cross-functional leadership
Cross-functional leadership
What I led:
A prioritization workshop to align around the MVP scope
A prioritization workshop to align around the MVP scope
A prioritization workshop to align around the MVP scope
A prioritization workshop to align around the MVP scope
Weekly syncs across teams to resolve blockers
Weekly syncs across teams to resolve blockers
Weekly syncs across teams to resolve blockers
Weekly syncs across teams to resolve blockers
A dashboard pilot with 6 Industry Leads to validate real-world usage before scaling
A dashboard pilot with 6 Industry Leads to validate real-world usage before scaling
A dashboard pilot with 6 Industry Leads to validate real-world usage before scaling
A dashboard pilot with 6 Industry Leads to validate real-world usage before scaling

Above: Industry Lead workflow, with time consuming processes in red.

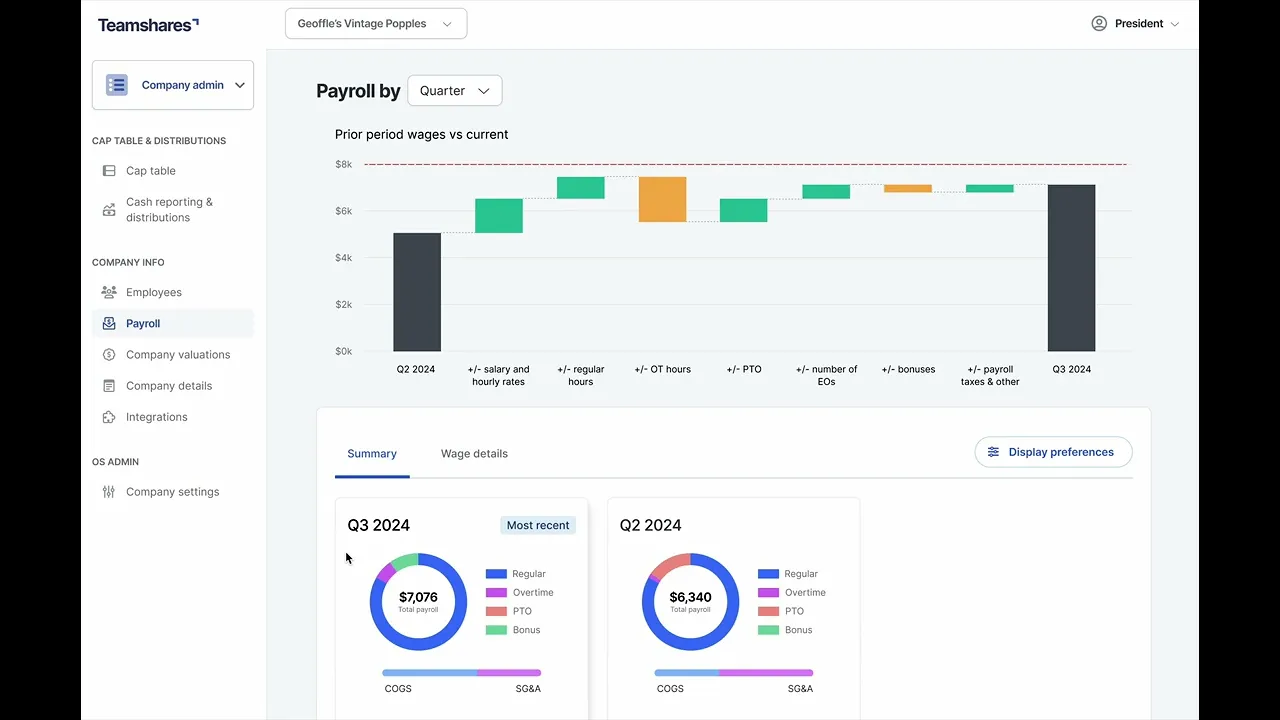
Above: an early iteration that lightened the lift on data compilation. Upon further discussions, I discovered that while displaying the right data, Industry Leads needed additional calculations and indicators for anomalies for proper analysis.
Above: an early iteration that lightened the lift on data compilation. Upon further discussions, I discovered that while displaying the right data, Industry Leads needed additional calculations and indicators for anomalies for proper analysis.
The ripples: affecting the ecosystem
The ripples: affecting the ecosystem
The ripples: affecting the ecosystem

During discovery, I noted the requirement of importing data from various payroll sources. Keeping aware of the broader system, I considered the pending undertaking of Financial Products need to integrate with QuickBooks, so I established a central place to perform integrations within TeamsharesOS (below).
During discovery, I noted the requirement of importing data from various payroll sources. Keeping aware of the broader system, I considered the pending undertaking of Financial Products need to integrate with QuickBooks, so I established a central place to perform integrations within TeamsharesOS (below).
During discovery, I noted the requirement of importing data from various payroll sources. Keeping aware of the broader system, I considered the pending undertaking of Financial Products need to integrate with QuickBooks, so I established a central place to perform integrations within TeamsharesOS (below).
During discovery, I noted the requirement of importing data from various payroll sources. Keeping aware of the broader system, I considered the pending undertaking of Financial Products need to integrate with QuickBooks, so I established a central place to perform integrations within TeamsharesOS (below).

Additionally, the capability of integrating with payroll systems meant accurate employee rosters. With payroll being the source-of-truth for employee rosters, this presented an opportunity to ease efforts for Teamshares Admins who issue Network Company shares to their employee-owners.
The initial integration prompts the merging of data to the cap table.

As employees are added and removed from payroll, we force an update on the Admin side to update the cap table to revise share allocations as a one-stop lightweight effort.
As employees are added and removed from payroll, we force an update on the Admin side to update the cap table to revise share allocations as a one-stop lightweight effort.
As employees are added and removed from payroll, we force an update on the Admin side to update the cap table to revise share allocations as a one-stop lightweight effort.
As employees are added and removed from payroll, we force an update on the Admin side to update the cap table to revise share allocations as a one-stop lightweight effort.

Optimizing industry lead workflows
Optimizing industry lead workflows
Optimizing industry lead workflows
Customer insight led to an integrated dashboard solution that eliminated tool-switching entirely. The research revealed dual-purpose opportunity that delivered more value than originally scoped.
Customer insight led to an integrated dashboard solution that eliminated tool-switching entirely. The research revealed dual-purpose opportunity that delivered more value than originally scoped.
Outcomes
Outcomes
Outcomes
Customer Efficiency: 50% reduction in analysis time (3 hours → 1.5 hours per company)
Customer Efficiency: 50% reduction in analysis time (3 hours → 1.5 hours per company)
Customer Efficiency: 50% reduction in analysis time (3 hours → 1.5 hours per company)
Customer Efficiency: 50% reduction in analysis time (3 hours → 1.5 hours per company)
Operational Scale: 135+ hours saved per cycle across entire network
Operational Scale: 135+ hours saved per cycle across entire network
Operational Scale: 135+ hours saved per cycle across entire network
Operational Scale: 135+ hours saved per cycle across entire network
Platform Adoption: Integration patterns adopted by other teams
Platform Adoption: Integration patterns adopted by other teams
Platform Adoption: Integration patterns adopted by other teams
Platform Adoption: Integration patterns adopted by other teams
Foundation Building: Established automated systems improving accuracy at scale
Foundation Building: Established automated systems improving accuracy at scale
Foundation Building: Established automated systems improving accuracy at scale
Foundation Building: Established automated systems improving accuracy at scale
More importantly, Industry Leads report feeling more confident in their work and having time to focus on strategic analysis rather than data wrangling. The tool has become central to monthly financial reviews across Teamshares.
More importantly, Industry Leads report feeling more confident in their work and having time to focus on strategic analysis rather than data wrangling. The tool has become central to monthly financial reviews across Teamshares.
Why this effort matters
Why this effort matters
Why this effort matters
This case wasn’t about just designing a dashboard — it was about enabling scale. It required reframing the problem, driving cross-functional alignment, and delivering systems-level thinking under operational pressure while bringing value organization-wide.
This case wasn’t about just designing a dashboard — it was about enabling scale. It required reframing the problem, driving cross-functional alignment, and delivering systems-level thinking under operational pressure while bringing value organization-wide.
As a Principal Product Designer, I thrive in ambiguity and high-impact spaces where design serves as a multiplier, not a phase.
As a Principal Product Designer, I thrive in ambiguity and high-impact spaces where design serves as a multiplier, not a phase.
As a Principal Product Designer, I thrive in ambiguity and high-impact spaces where design serves as a multiplier, not a phase.
As a Principal Product Designer, I thrive in ambiguity and high-impact spaces where design serves as a multiplier, not a phase.
Hello, I'm Dante
Design and haiku is fun
Here's an example
Set up some face time
Look, this link is clickable
Reach out, don't be shy.
Hello, I'm Dante
Design and haiku is fun
Here's an example
Set up some face time
Look, this link is clickable
Reach out, don't be shy.
Hello, I'm Dante
Design and haiku is fun
Here's an example
Set up some face time
Look, this link is clickable
Reach out, don't be shy.
Hello, I'm Dante
Design and haiku is fun
Here's an example
Set up some face time
Look, this link is clickable
Reach out, don't be shy.